Cloud Drop Spectrometer
Cloud Drop Spectrometer (CDS)
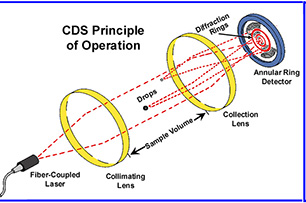
The novel instrument proposed here, a cloud drop spectrometer (CDS), makes measurements of drop size distribution (DSD) and liquid water content (LWC) from an ensemble of cloud drops. Figure 1a shows a simplified conceptual drawing illustrating the basic principle of operation of the CDS. A fiber-coupled laser beam is collimated and illuminates the sample volume. The collimated beam is focused by a collection lens and passes through a hole in the center of the custom annular detector shown in Figure 1b. A beam dump subsequently traps light passing through the hole in the detector. When an ensemble of drops is present in the sample volume, the light scattered from each drop produces diffraction rings that are a function of drop size (examples of scattering patterns for two drops are shown in Figure 1a). The collection lens acts as a “Fourier lens”, mapping the light onto an annular photo detector with 64 individual detector arcs, which measure the intensity of the forward scattered light from 0.2° to 10°. The properties of a Fourier lens result in a collection scheme that is independent of the location of the drops in the sample volume. The intensity of light scattered in the sample volume is a function of scattering angle, irrespective of where in the sample volume the scattering takes place. Because the intensity of scattered light decreases exponentially with scattering angle, the area of each detector arc increases exponentially outward in order to produce a constant ratio between each successive collection angle.

Figure 1. a) Conceptual diagram of CDS electro-optics, and b) Custom annular detector.
The CDS makes measurements DSD and LWC) from an ensemble of cloud drops, providing a sample volume that is orders of magnitude larger than single-drop measurements (e.g., FSSP, CDP, FCDP). Single-drop scattering instruments are limited to an extremely small sample volume because the drop must be within the optical depth of field, which is on the order of a few mm for these small drops. Additional advantages of the CDS are that the measurements are independent of airspeed and extend from 2 µm to 200 µm, which overlaps the size ranges of scattering probes (2 to 50 µm) and the (10 to 1,280 µm) size range of the 2D-S optical array probe (OAP). The CDS independently measures LWC from the same ensemble of drops used to compute DSD. In contrast, LWC is computed from single-drop devices by cubing the size of individual drops and summing, thereby also cubing the error in sizing measurement.
A prototype CDS was built in 1995, lab tested in the Ottawa icing tunnel and flown on the NCAR C-130 in marine cumulus clouds. Lawson and Blyth (1998) show encouraging results from these preliminary tests (Figure 2). However, the prototype used a commercial CCD linear array detector that was not optimized for the circular diffraction rings. The result was that the prototype CDS was not sensitive to low values of LWC and needed to be baselined when out of cloud. In the current instrument, the annular detector (Figure 1b) does not suffer from these problems and custom electronics have been designed to increase signal-to-noise. Figure 3 shows a new system-on-a-chip (SOC) introduced by Texas Instruments (TI) that is designed to process signals from photodiodes. The TI DDC family of SoCs has up to 256 current inputs, each with an integrated TIA and a 20-bit ADC. can be ordered with 2, 4, 8, 16, 32, 64, 128 or 256 inputs. The SoCs have a current-input ADC that combines both current-to-voltage and A/D conversion so that each separate low-level current output device, such as a photodiode, can be directly connected to its input and digitized, which results in a much higher S/N than using a string of individual components (i.e., transimpedance amplifiers).
Lawson, R. P., and A. M. Blyth, 1998: A comparison of optical measurements of liquid water content and drop size distribution in adiabatic regions of Florida cumuli. Atmos. Res., 47-48, 671-690.
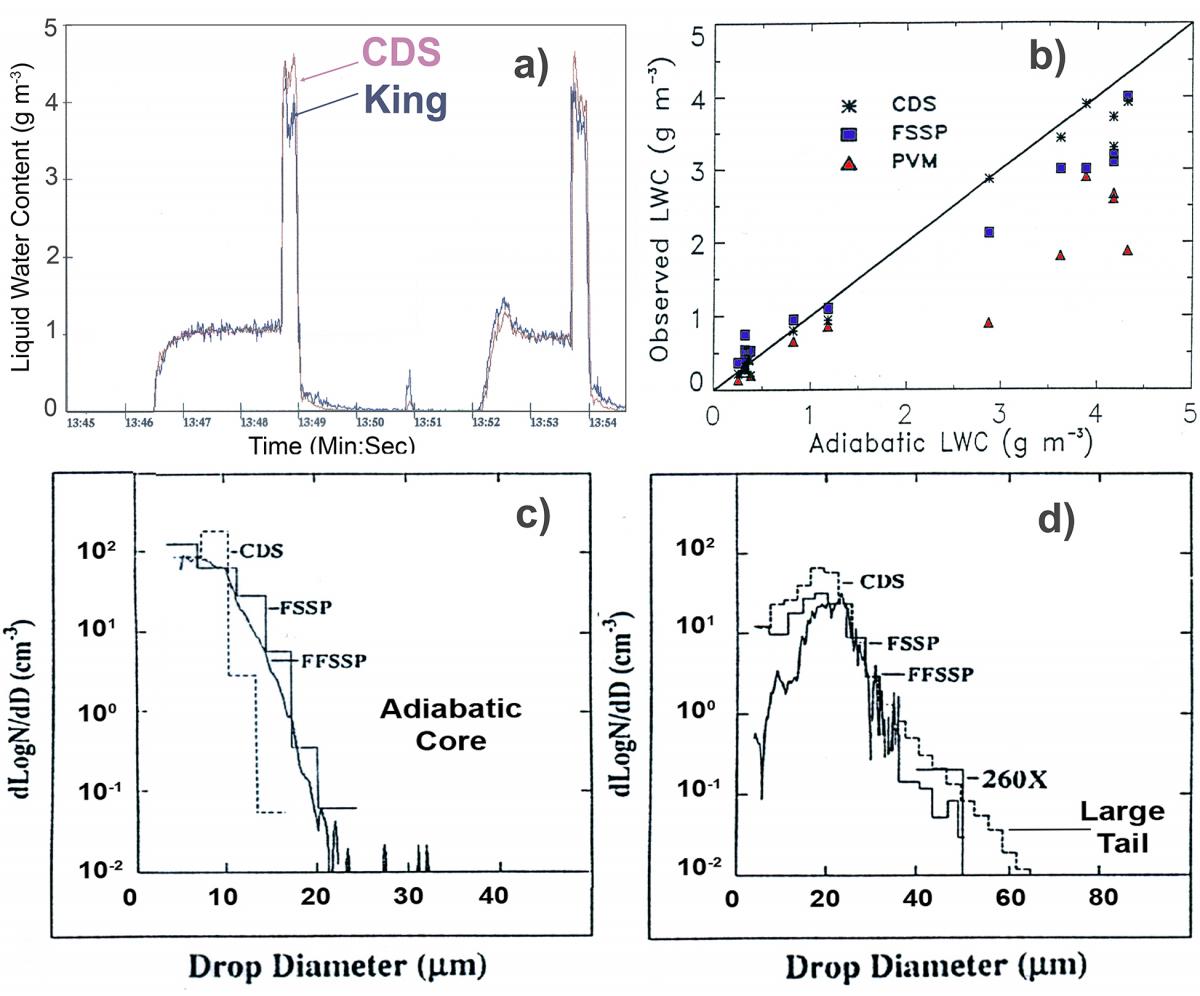
Figure 2. a) Comparison of LWC measured by a King probe and the 1995 prototype CDS in the Canadian NRC icing tunnel, b) Comparison of LWC measured in adiabatic cores by FSSP, PVM and prototype CDS installed on the NCAR C-130 during the 1995 SCMS project, and examples of DSDs measured by an FSSP, FFSSP, 260X and prototype CDS installed on the C-130 during penetration of c) an adiabatic core where a narrow DSD is expected, and d) a region of cloud where coalescence had initiated and large drops are expected.
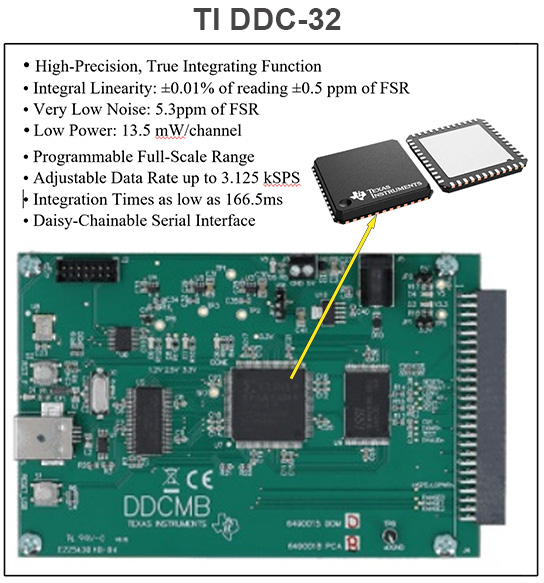
Figure 3. TI: DDC switched integrator used to condition signals from the annular detector.